Forty-four percent.
A researcher is funded to find something out. A higher education leader is paid to steer an institution through decisions about students, money and reputation. Both live on data. Both lose a large part of the week to getting at it.
The numbers behind the feeling
In the US, the Federal Demonstration Partnership has surveyed federally funded researchers on their workload since 2005. In its 2018 survey, 44.3% of project time went on administration, leaving 55.7% for research. Earlier surveys found about 42%. The share has not fallen in over a decade.
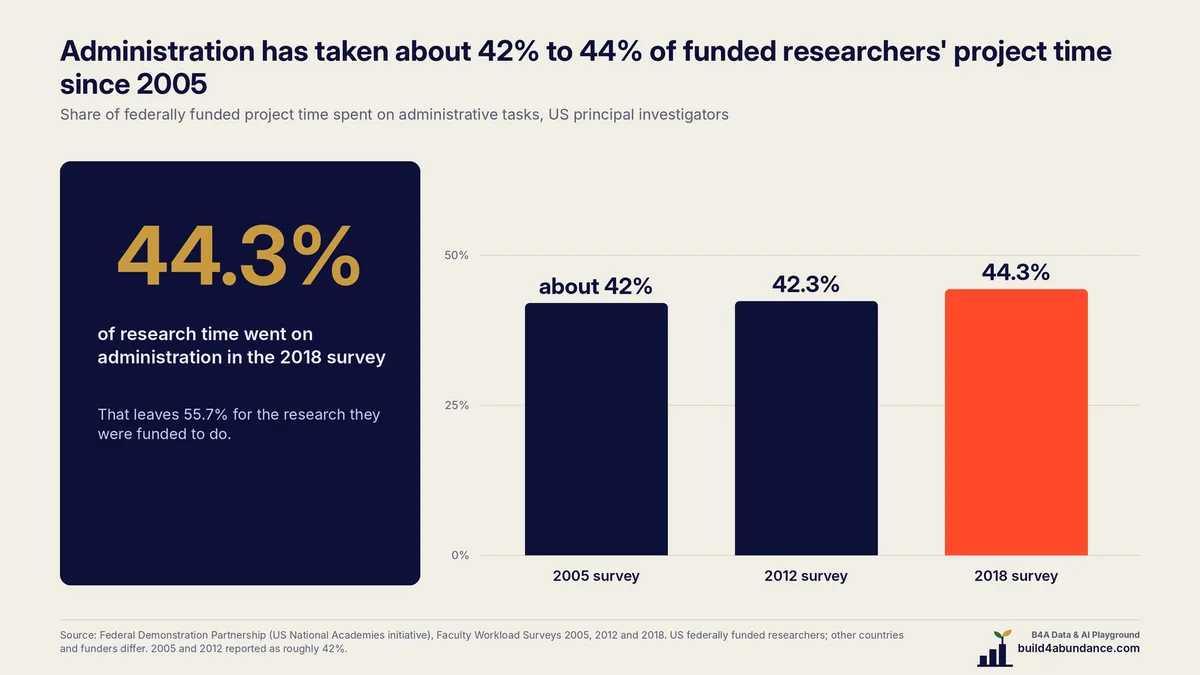
Show and tell: real survey data, for US federally funded researchers. Other countries and funders differ, but the pattern will be familiar.
Where it hurts, for the researcher
- Reporting, compliance and grant management take time that was meant for the work.
- Data sits in many places. Lab notebooks, spreadsheets, shared drives, funder portals.
- Sources are hard to trace. Months later, nobody can say where a number came from.
Where it hurts, for the higher ed leader
- Data lives in silos. The registrar, advancement, finance and the research office each hold a piece, with different definitions.
- Senior teams get rankings and tables, not decisions. What do we do about enrolment, funding or partnerships?
- Public data is rich but scattered. UNESCO, OECD, national statistics offices: the facts are there if someone has the time to pull them together.
Three habits that give time back
- Keep a source log. For every number: where it comes from, the date, the link. It takes seconds when you do it as you go, and hours when you rebuild it later.
- Write the question brief first. One page: the decision, who decides, by when, what would change your mind. It stops a project from growing sideways.
- State what the data cannot show. One sentence per chart. It protects your credibility and saves a round of review questions.
Why we built it
The B4A Data and AI Playground publishes a Higher Ed series built from public data, with the source on every chart. For institutions, the Studio builds the same kind of picture from your own numbers, and our Program Impact Dashboards help teams turn monitoring and evaluation data into something a board or funder can follow.
Sources
- Federal Demonstration Partnership, Faculty Workload Surveys 2005, 2012 and 2018 (US National Academies initiative). The 2005 and 2012 surveys are reported at roughly 42%; the 2018 survey at 44.3%. US federally funded principal investigators.